Firearm Homicides vs Legislation
For the Data Visualization course at U-tad we had to build a Tableau project using exactly two datasets, and they had to come from two different file formats. That constraint shaped everything. I ended up with a CSV on estimated gun ownership by state and year, and an Excel file tracking 72 binary firearm law indicators per state per year. The natural question those two datasets point at is: do states with more or stronger laws have lower firearm homicide rates?
The choice wasn’t random. I’ve been following the debate around firearm legislation in the US for a long time, and one thing that keeps coming up is that nobody seems to agree on whether legislation actually helps, what kinds of laws have any real effect, or even where the problem actually comes from. I wanted to use the data I had to try to get at least part of that question into a more concrete shape.
That said, I want to be upfront about what the constraint ruled out. With a third dataset covering things like poverty rates, urbanisation, mental health access, or policing levels, I could have done a much more complete analysis of what actually drives firearm violence. What I have is a picture of the relationship between legislation and homicides specifically, which is meaningful but not the whole story.
The data
- Kang et al. (Harvard Dataverse): state-year data from 1949 to 2023. It uses the firearm suicide proxy (FSS) to estimate household gun ownership, since direct ownership figures aren’t publicly available at state level. FSS is the share of suicides committed with a firearm, a proxy with a solid track record in public health research. The column I actually used as the outcome variable was firearm homicide rate, not FSS itself.
- Tufts CTSI State Firearm Law Database: 72 binary law indicators per state per year from 1976 to 2024. Things like permit requirements, waiting periods, background check rules, assault weapon restrictions, gun-violence restraining orders.
The two were joined in Tableau on state and year, many-to-many with “some records match” on both sides. That setting matters: it keeps rows even when a key only exists in one table, rather than silently dropping them. The overlapping range gives a final analysis window of 1976 to 2023. Washington D.C. was excluded since it only appears in one of the datasets.
The research questions
I defined the questions after exploring the data rather than before, so they’d be grounded in what the datasets could actually answer. The starting point was the obvious cross-sectional one: do states with more or stronger laws have lower homicide rates right now? From there I added time, grouping states by their law profile and seeing how those groups have diverged since 1976. Then I zoomed into individual states to see whether legislative growth in a specific place corresponds to an improvement in its national ranking over time. Each question builds on the previous one rather than standing alone.
Law categorisation
With 72 laws tracked across 50 states over nearly five decades, the data can turn into a mess very fast if you try to look at everything at once. Grouping laws into categories was the way to make it legible. But I also wanted the grouping to measure two different things, because they’re actually different questions: does it matter how many laws a state has passed, or does it matter what type of laws they passed? To test both, I built two categorisation schemes and wired them to a shared parameter so you can switch between them across every chart.
By quantity: Low (10 or fewer laws), Medium (11 to 25), High (more than 25). Simple tiers based on total law count.
By type: Rather than using all 72, I picked two subsets based on research. The three most commonly adopted laws I called Popular: concealed-carry permit, waiting period, state background check. The three with the strongest evidence base in the literature I called Evidence-Based: universal background checks, gun-violence restraining orders, assault weapon restrictions. States then fall into Weak, Popular, Evidence, or Both depending on how many from each group they’ve passed.
This way the same charts can answer both questions, and you can see whether the type of law or the sheer number of laws is the stronger signal.
The visualisations
Q1: The starting picture
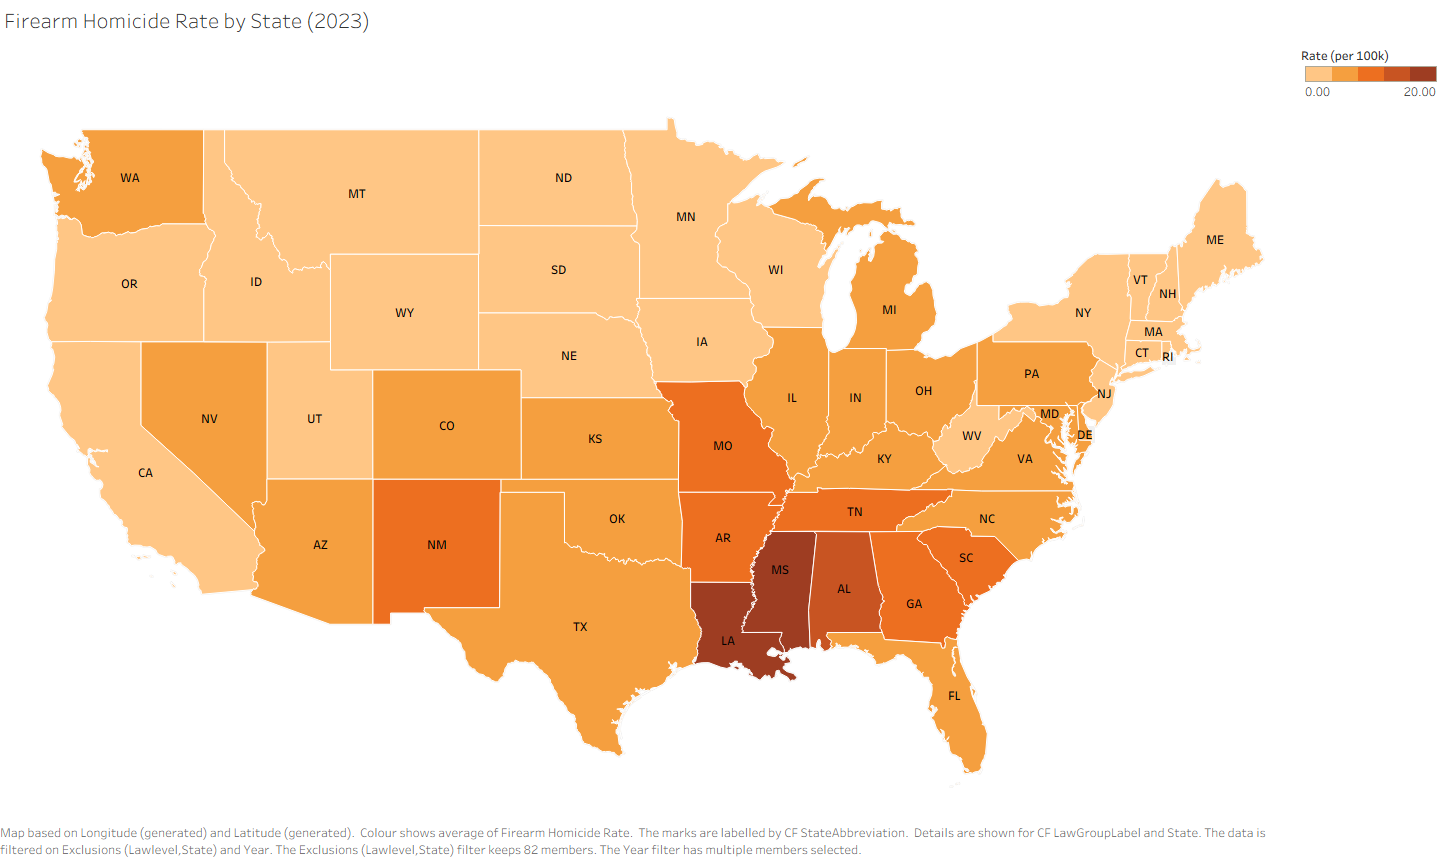
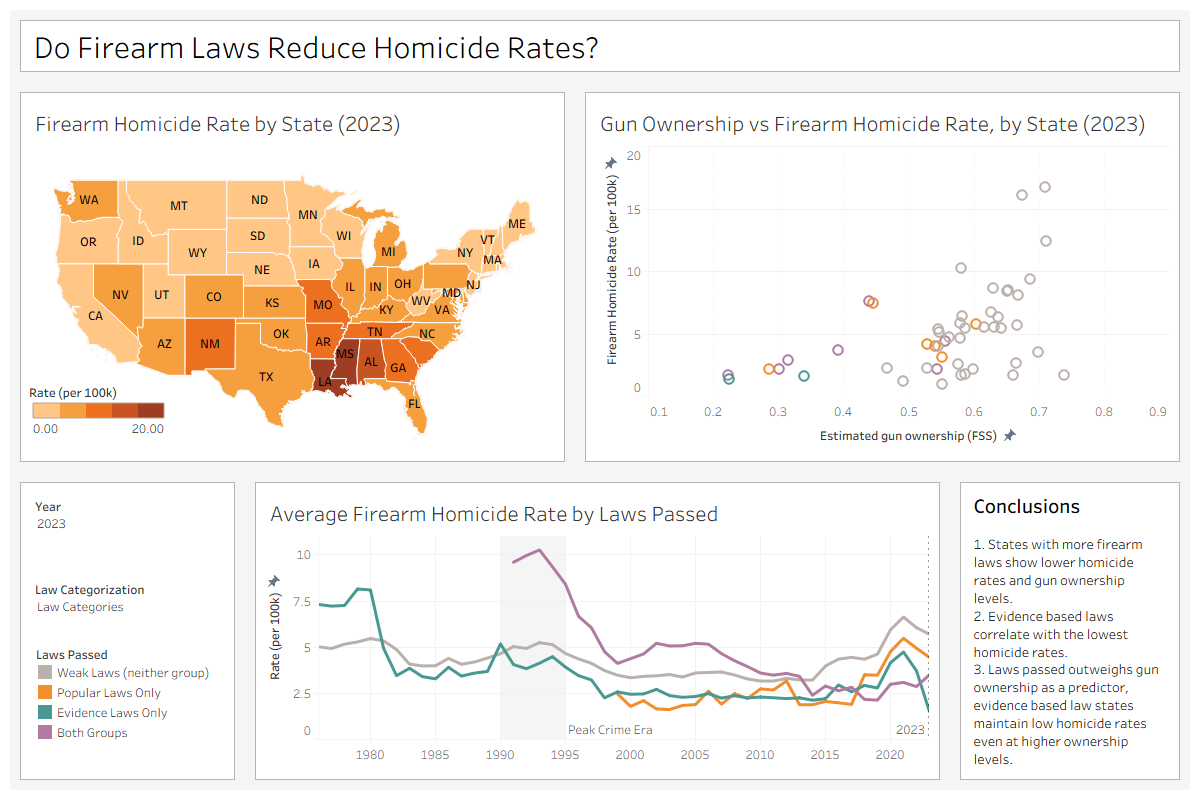
The first chart is a choropleth map showing firearm homicide rate by state for a chosen year. Darker orange means higher rate. State abbreviations are shown on each mark via a calculated field (all 50 CASE clauses, which I generated with AI since it’s pure typing with no analytical value).
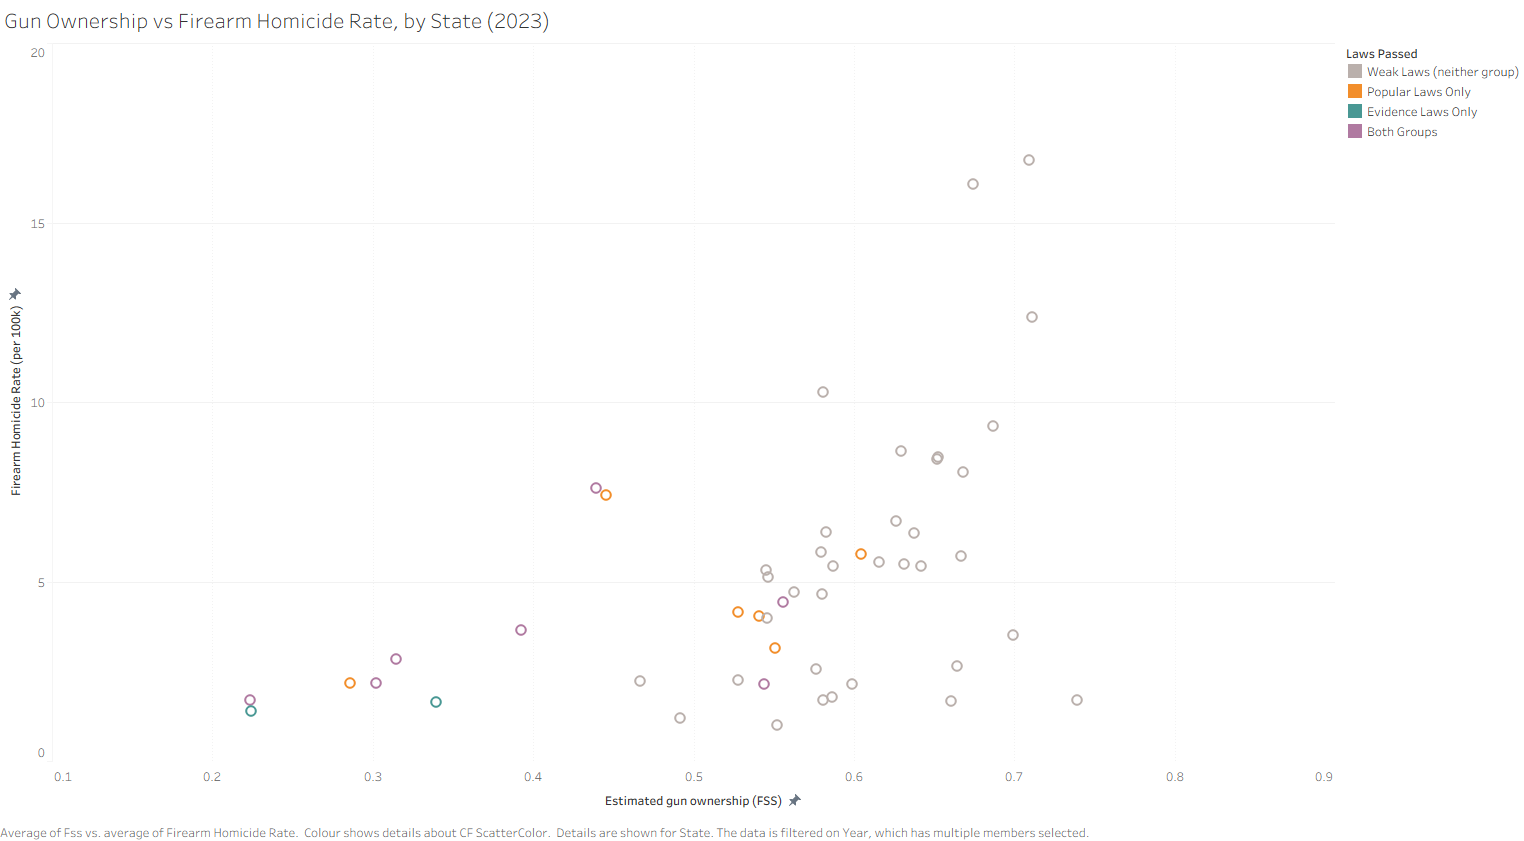
The second is a scatter plot with law count on one axis and estimated ownership (FSS) on the other, coloured by law profile. The same categorisation parameter from the map applies here too.
Q2: Adding time
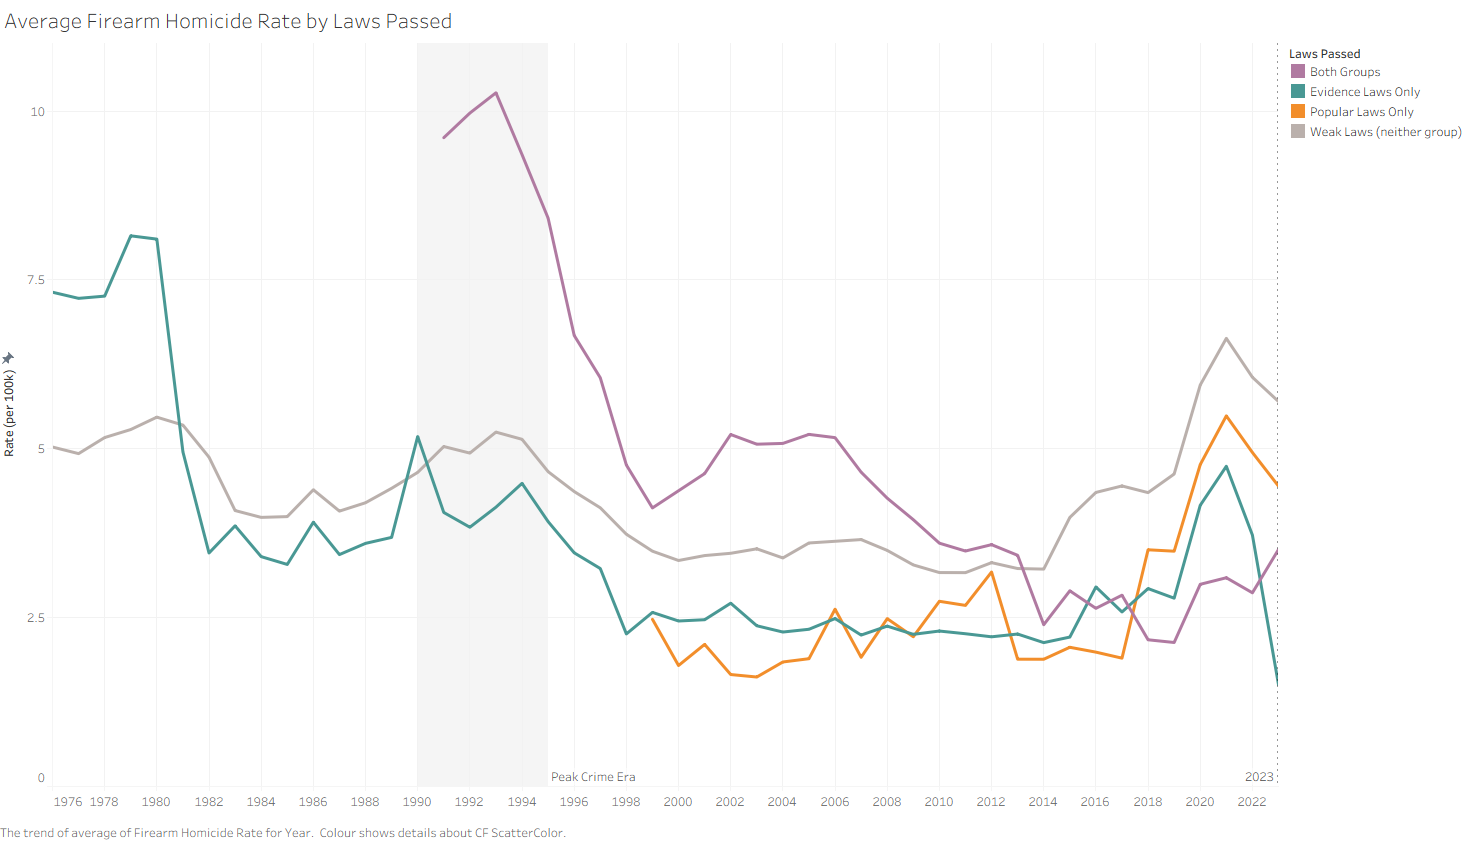
A line chart running from 1976 to 2023, one line per group of states. A vertical reference line marks whatever year is selected on the map, linking the two charts. The gap between the high-law and low-law groups is probably the most visually striking thing in the whole project.
Q3: Single-state deep dive
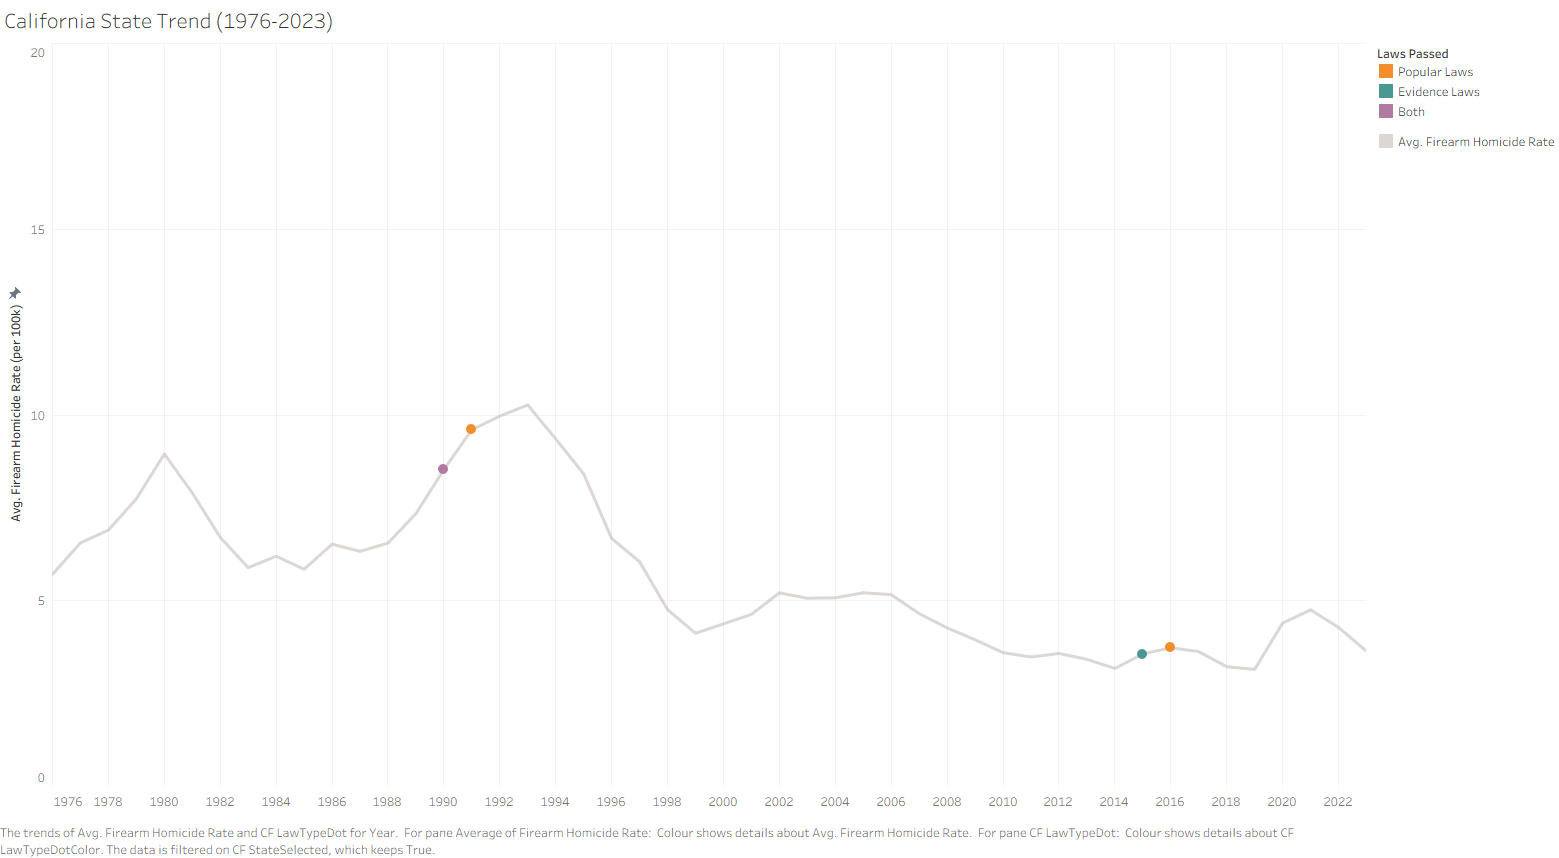
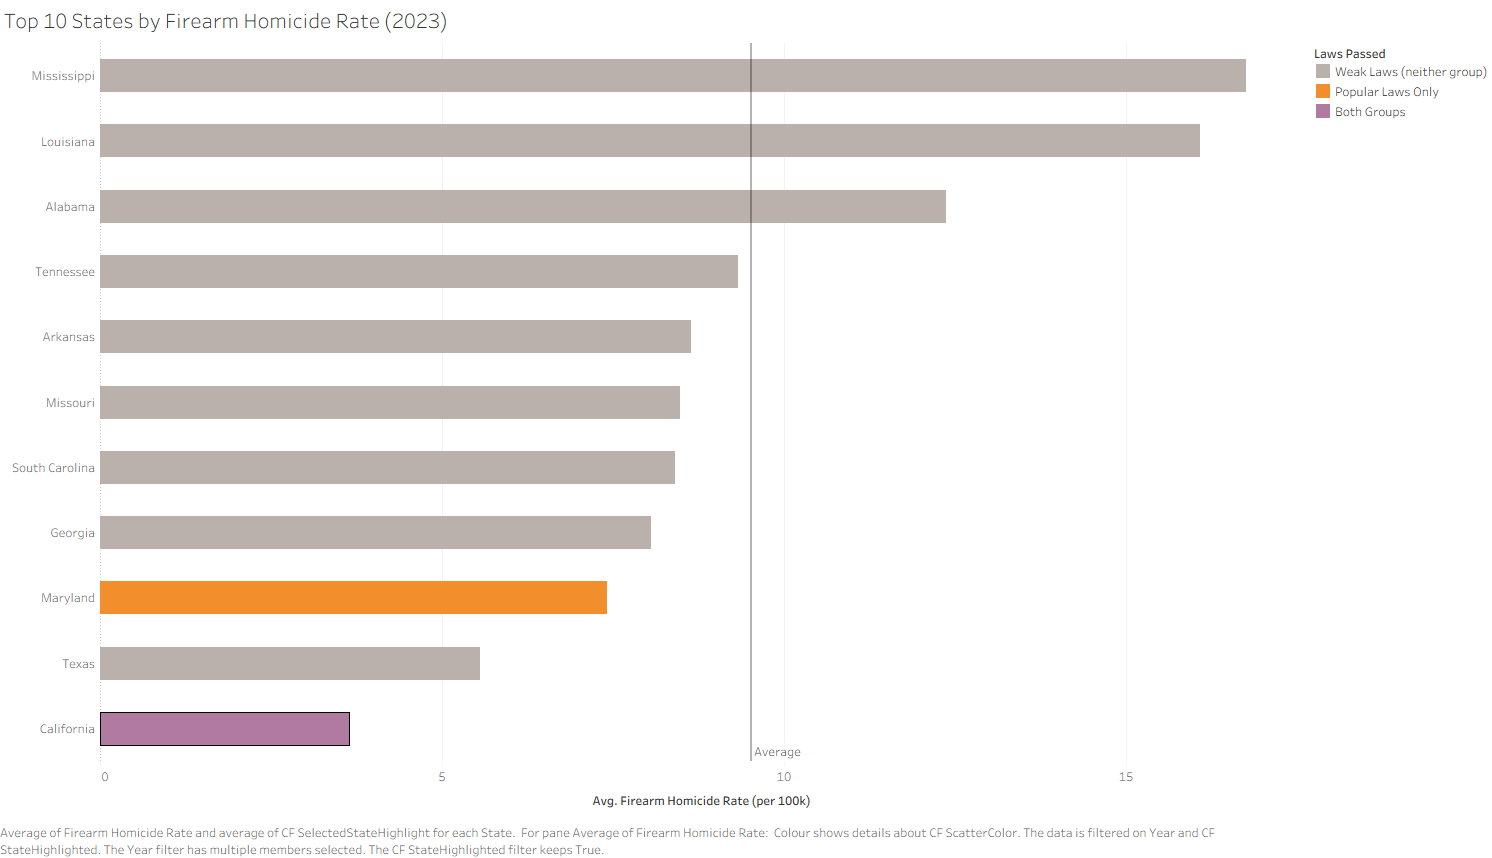
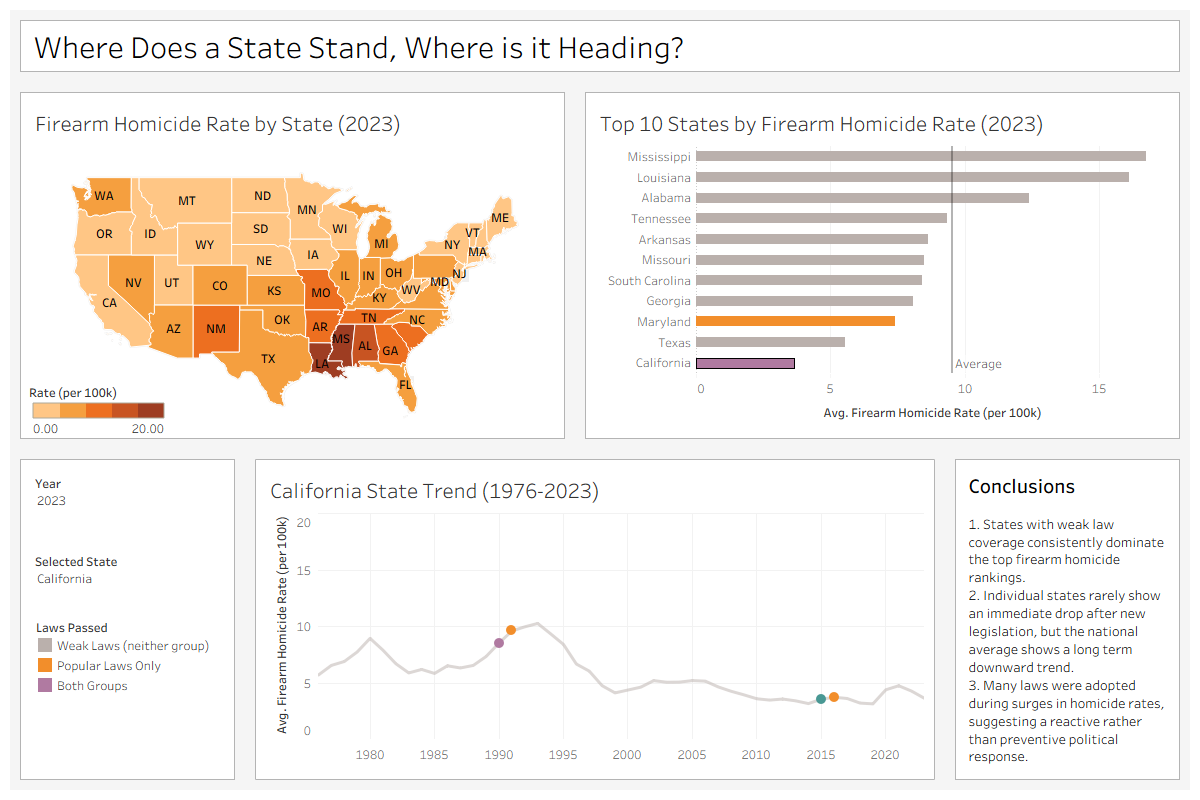
A line chart showing how a selected state’s law count has grown over time, alongside a bar chart that ranks all states by homicide rate for a chosen year with the selected state highlighted. Both are linked by a shared state parameter, so you can pick any state and the two charts update together.
Dashboards
Dashboard 1 puts the map, scatter, and Q2 line chart together. Clicking a state on the map highlights it in the scatter, and the year parameter drops a reference line in the trend chart at the same time.
Dashboard 2 is the Q3 view with the map kept as a geographic anchor. Clicking any state on the map updates both the ranking bar chart and the law history line simultaneously.
Supplementary event study
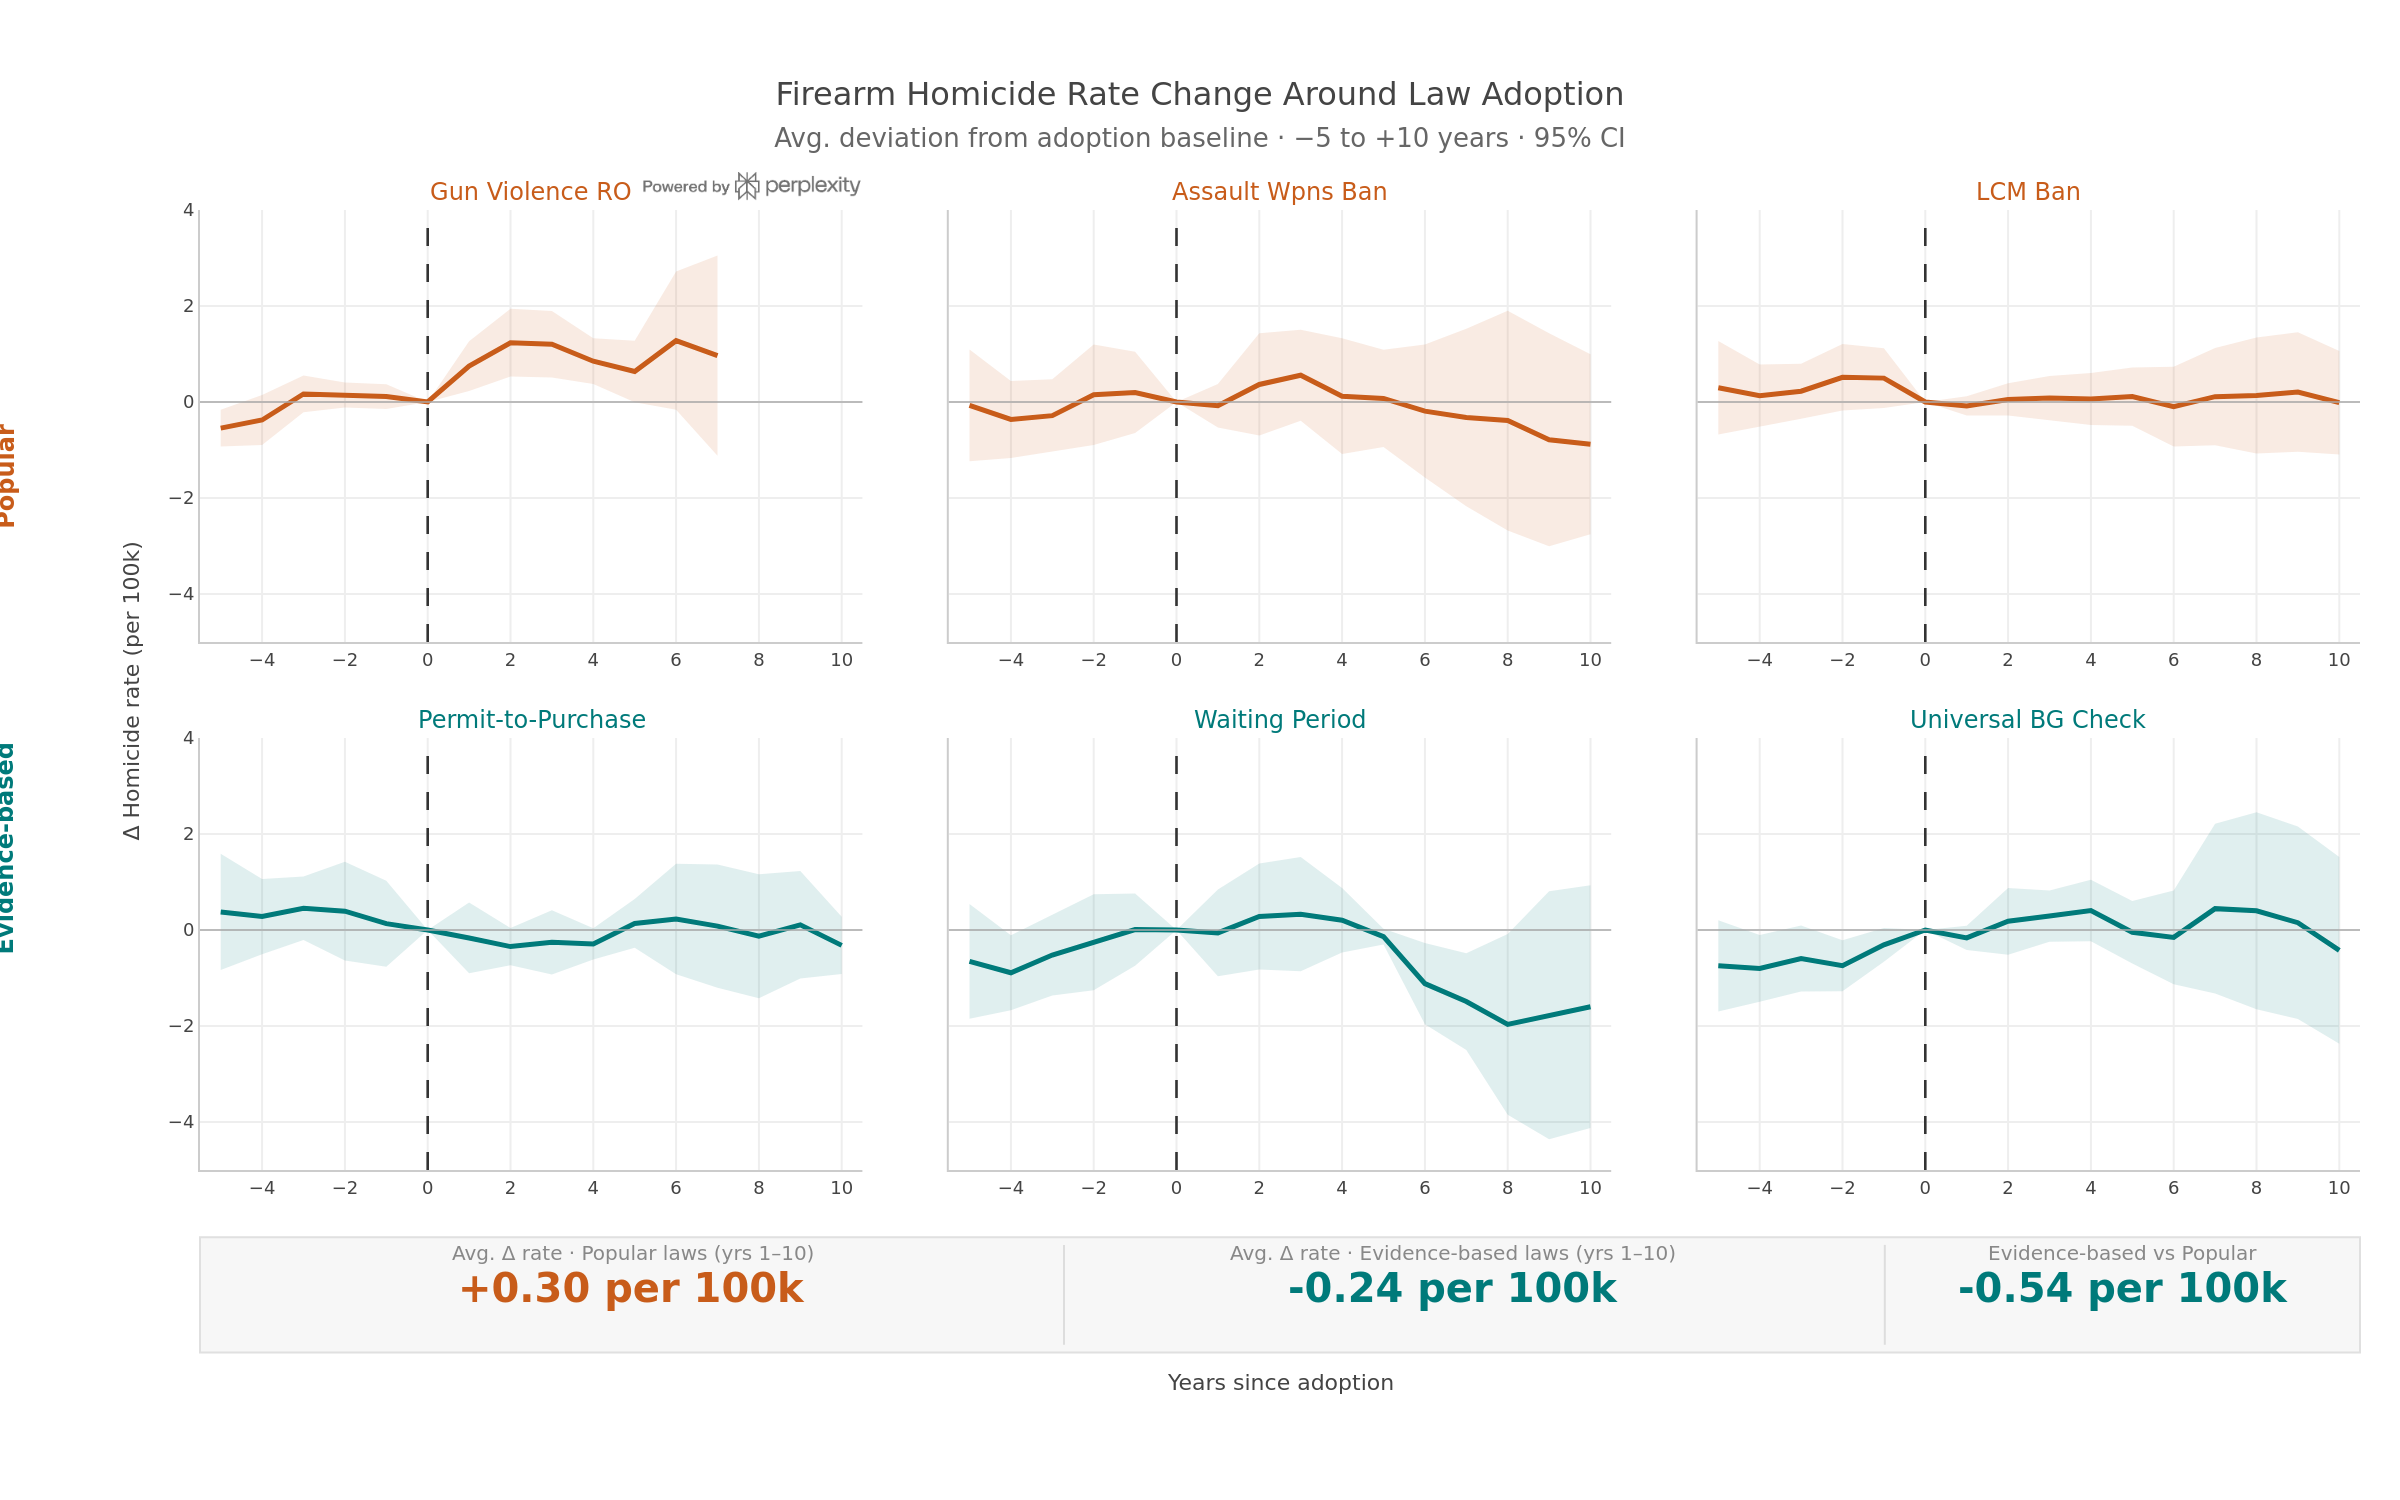
On top of the Tableau work I ran an event-study style chart in Python to compare how homicide rates move around the moment a state adopts a popular law versus an evidence-based one. The idea is to average across all states that adopted each law and plot the trajectory from five years before to ten years after adoption.
All five laws are followed by a decline, but evidence-based ones drop faster and hold lower for longer. Universal Background Checks shows the sharpest improvement. Popular laws do improve things, just more gradually.
What I took away from it
The two-dataset constraint meant I could only look at one outcome: homicide rates. I couldn’t fold in suicide rates, non-fatal injuries, or broader social indicators that likely interact with both legislation and violence. That’s the honest limitation of the project.
Within what the data can show, the picture is consistent across every view: states with fewer or weaker laws tend to sit at the higher end of the homicide distribution, and the gap between high-law and low-law groups has grown since the 1990s.
The more interesting finding is the type-versus-quantity question. The popular laws, the ones that get passed most often, are probably popular precisely because they’re politically easier to push through. But the event study suggests they’re not where the effect actually lives. Evidence-based laws show a steeper and more sustained post-adoption decline, which implies that the political difficulty of passing stronger legislation might be exactly correlated with how much it would actually help. That’s not a comfortable conclusion for anyone who thinks incremental progress is enough.
None of this is causal. There’s no confounder control, no regression, no instrument. But across multiple groupings, chart types, and time periods, the direction is the same. How a state regulates firearms is closely tied to how often guns are used to kill.
Full workbook and data on GitHub.